
Electron Paramagnetic Resonance (EPR)
Application Description
Electron paramagnetic resonance (EPR) or electron spin resonance (ESR) is one of the most informative techniques on the electronic structure of paramagnetic species. EPR spectroscopy is particularly suitable for the investigation of (bio)chemical systems with strongly localized spin density and their interaction with the environment. For these systems EPR provides information on the structure and dynamics and is widely used in chemistry, physics and biology.
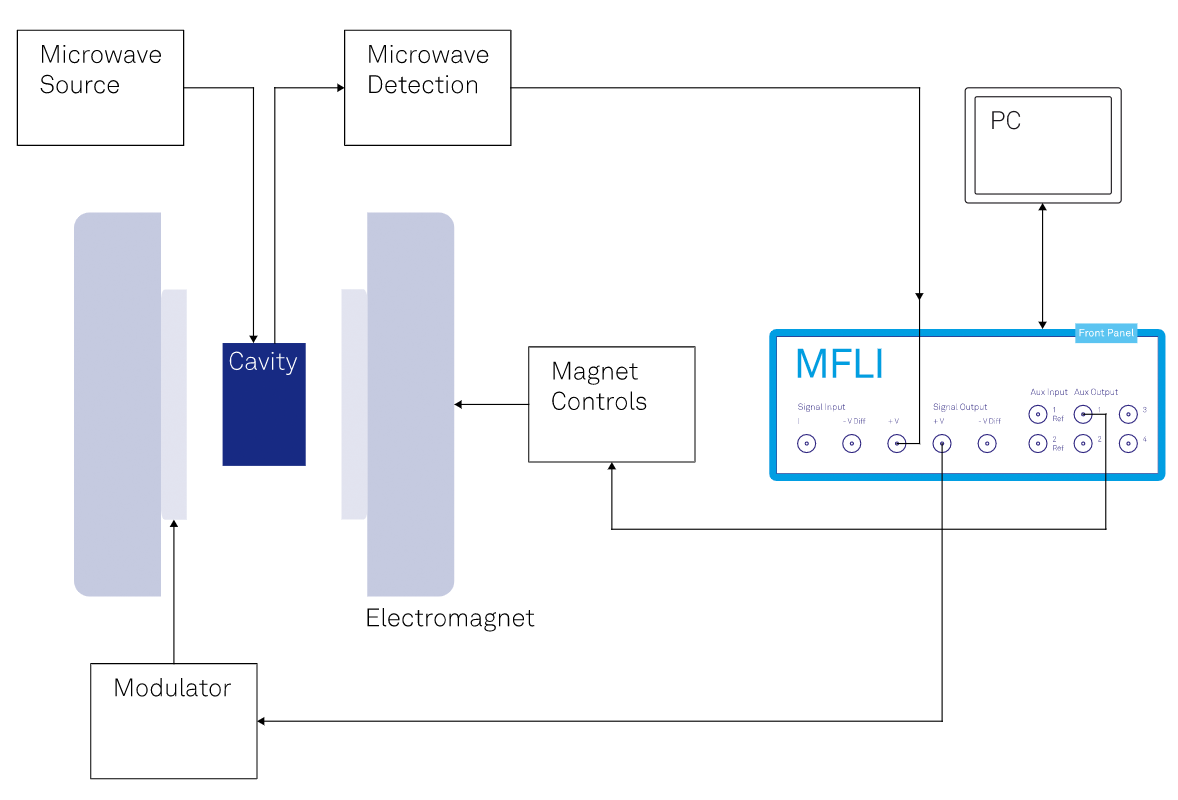
EPR measurements are typically performed in continuous-wave (cw) or in pulsed mode. The cwEPR spectrometer (see image) applies a magnetic field of about 3500 G (0.35 T) and measures the absorption of microwaves in the 9-10 GHz regime (X-Band). Usually, the microwave is kept at a fixed frequency and the magnetic field is swept (for the X-Band, from 0 mT - 700 mT).
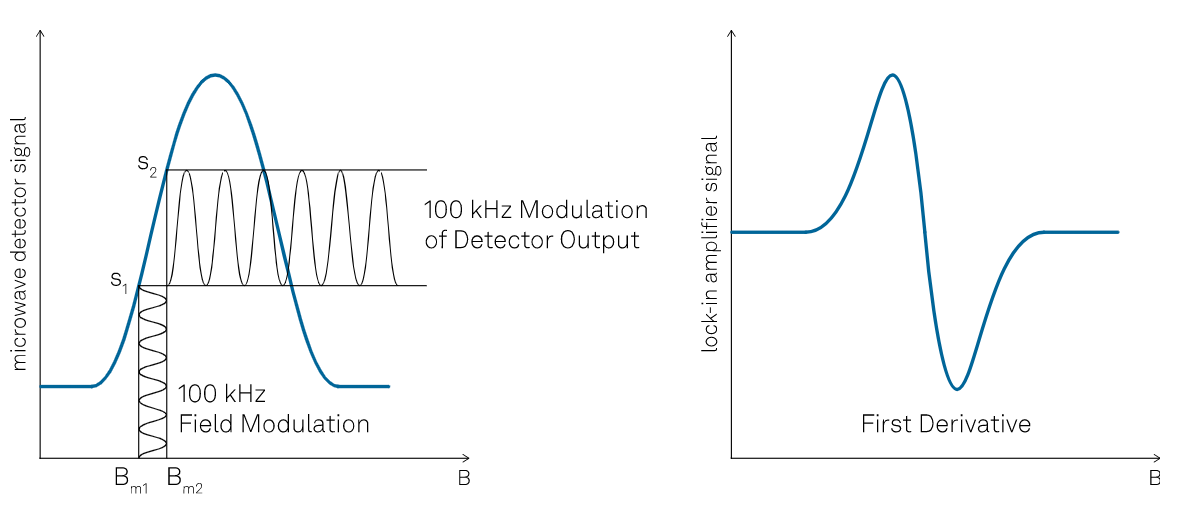
The left panel of this figure shows a typical signal detected with the microwave detector. The application of a small additional oscillating magnetic field at a typical frequency of 100 kHz improves the sensitivity using lock-in detection and adds the ability of extracting phase information. The resulting signal is the first derivative of the absorption, as illustrated in the right panel of the figure.
Measurement Strategies
To achieve high resolution in a short acquisition time, a trade-off needs to be reached based on three parameters: modulation frequency, modulation amplitude, and lock-in filter bandwidth.
First, the spectral resolution depends on the signal-to-noise ratio (SNR) and on the spectral distortion, which are both influenced by the amplitude of the magnetic field modulation. Large modulation amplitudes increase the SNR following an increase in signal intensity. At large amplitudes, however, the detected EPR signal broadens and becomes distorted, hence decreasing the resolution because close lines cannot be resolved. A similar distortion effect applies when high modulation frequencies are used and the spin relaxation is too slow to follow fast changes in the magnetic field.
Moreover, the SNR and the spectral resolution directly depend on the modulation frequency. This is a consequence of lock-in detection, as explained in detail in the Principles of Lock-in Detection White Paper. A high modulation frequency results in high SNR - but it will also cause spectral distortion, as described above.
Finally, the filter bandwidth used for lock-in detection also impacts on the SNR and on the acquisition time. A low filter bandwidth causes a high SNR but leads to a slow acquisition time at each step of the magnetic field sweep, because low filter bandwidths need slow settling times. Another way to achieve high SNR is by averaging - remembering that the SNR is proportional to the averaging time - and using a large filter bandwidth with fast settling times and fast acquisition times. In a stable laboratory environment and with a stable spectrometer, signal averaging with a large filter bandwidth and few averages with a low filter bandwidth are equivalent. In reality, signal drifts must be taken into account. This requires finding suitable trade-offs between the filter bandwidths and the averaging time.
The following table summarizes the parameters and their effect on resolution and acquisition time.
| SNR | spectral distortion | time constant | acquisition time | |
|---|---|---|---|---|
| modulation amplitude small | low | small | X | X |
| modulation amplitude large | high | large | X | X |
| modulation frequency low | low | small | X | X |
| modulation frequency high | high | large | X | X |
| filter bandwidth low | high | X | large | slow |
| filter bandwidth high | low | X | small | fast |
X = no effect
An ideal cwEPR measurement needs judicious tuning of the modulation amplitude and frequency as well as of the filter bandwidth and the number of averages. For this crucial tuning, EPR users need instruments that provide full control over these parameters while offering tools to analyze signals in the time and frequency domain to judge on the SNR and the spectral resolution.
The Benefits of Choosing Zurich Instruments
Considering the requirements for an ideal cwEPR measurement, the Zurich Instruments MFLI 500 kHz Lock-in Amplifier is a perfect match for cwEPR:
- A small time constant and a low input voltage noise ensure make short acquisition times possible.
- You can be in full control of your measurements thanks to a web interface that can be accessed via any browser.
- Observe and record all relevant time-domain and frequency-domain signals with the LabOne® Plotter and Spectrum Analyzer tools.
- No additional digitizer card is required to record your measurements, so that you can simplify your setup and enjoy the high level of integration. The MFLI comes with a fast digital data transfer through USB or 1 GbE connections.
- The auxiliary outputs of the instrument can be used to sweep the magnetic field or microwave. Together with the large number of available APIs (Python, C, MATLAB®, LabVIEW™ and .NET), it is easy to integrate the MFLI into existing cwEPR spectrometer setups.